
Most coaching KPI dashboards fail because they track vanity metrics instead of operational reality. You end up with a pretty spreadsheet showing session counts and revenue totals while completely missing the indicators that actually predict whether a client will renew, refer others, or quietly ghost you next month.
The pattern across coaching practices—from solo executive coaches to multi-practitioner wellness centers—is pretty consistent: coaches track what's easy to measure, not what actually matters for growth. The result is that you're flying blind until problems become emergencies.
Your intake forms collect basic info. Your billing system processes payments. Your session notes sit in folders. But those three data sources already contain everything you need to predict and prevent operational failures. The problem isn't a lack of data—it's that nobody connects it into anything useful.
The Core 12 KPIs That Actually Predict Coaching Business Health
Revenue Health Metrics
1. Effective Hourly Rate (EHR) Data source: Billing records + Calendar Formula: Total collected revenue ÷ Total hours (sessions + prep + admin) Target range: $85–$180 depending on niche Most coaches calculate their session rate and stop there. But once you factor in the 15-minute prep, 10-minute notes, and the inevitable schedule shuffling, that $150/hour rate often drops closer to $92. Tracking EHR forces you to see the real economics of your practice.
2. Collection Rate Data source: Billing system (invoiced vs collected) Formula: Amount collected ÷ Amount invoiced × 100 Target: >94% The gap between what you invoice and what you collect tells you whether your payment processes actually work. Drop below 90% and you're essentially offering unintentional pro-bono services.
3. Revenue Per Active Client (RPAC) Data source: Billing records filtered by active status Formula: Monthly revenue ÷ Active client count Target: Varies by model ($400–$2,000/month typical)
Client Flow Metrics
4. Conversion Rate Data source: Intake forms + First billing record Formula: Paid clients ÷ Total consultations × 100 Target: >35% for most niches Track this from initial contact through first payment—not just "expressed interest." A lot of coaches claim 60% conversion rates by counting everyone who said yes in principle, while ignoring the 40% who never actually started.
5. First 30-Day Activation Data source: Session records + Intake dates Formula: Clients completing 3+ sessions in first 30 days ÷ New starts Target: >75% Clients who complete fewer than three sessions in their first month have a significantly higher chance of dropping within 90 days. This metric catches engagement problems before they turn into retention disasters.
6. Average Client Lifetime Data source: Intake date + Termination date from billing Formula: Sum of all client durations ÷ Total clients Target: 6–18 months depending on practice type
Operational Efficiency Metrics
7. Utilization Rate Data source: Calendar (available slots vs booked) Formula: Booked sessions ÷ Available slots × 100 Target: 70–85% Below 70% usually points to marketing or pricing problems. Above 85% creates scheduling pressure and limits your ability to grow. The sweet spot gives you flexibility without sacrificing profitability.
8. No-Show/Late Cancel Rate Data source: Calendar + Session notes Formula: (No-shows + Late cancels) ÷ Total scheduled × 100 Target: <8%
9. Admin Time Ratio Data source: Time tracking or calendar analysis Formula: Admin hours ÷ Total working hours × 100 Target: <25% When admin creeps above 30%, you're running a paperwork business that happens to include some coaching. That's usually a sign of broken systems or a genuine need for operational software to handle routine tasks.
Growth Indicators
10. Referral Percentage Data source: Intake forms (referral source field) Formula: Referral clients ÷ Total new clients × 100 Target: >40% Low referral rates usually mean either a service quality issue or you're not creating moments worth sharing. High rates tend to indicate strong outcomes and a good overall client experience.
11. Reactivation Rate Data source: Billing records (returning after 60+ day gap) Formula: Reactivated clients ÷ Total past clients × 100 Target: >15% annually Former clients coming back validates your long-term value. Below 10% is a signal that you're not staying connected after engagements end.
12. Program Completion Rate Data source: Session notes + Program definitions Formula: Completed programs ÷ Started programs × 100 Target: >65% Whether it's a 12-session package or a 6-month program, completion rates tell you whether your structure actually delivers within the expected timeframe.
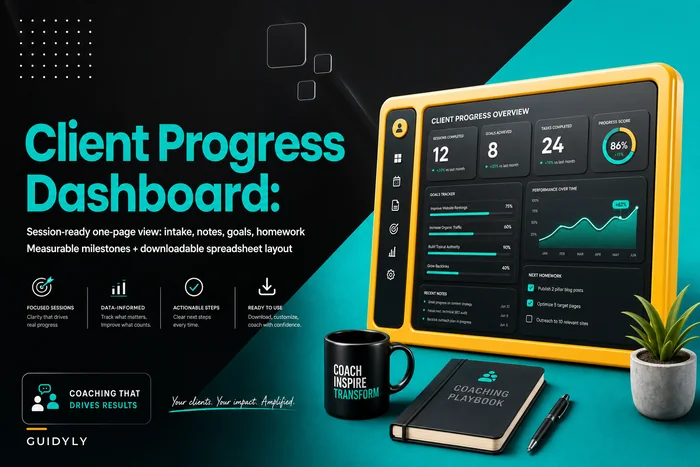
Building Your Operational Dashboard
Here's a practical layout that connects these KPIs for quick diagnosis:
Never miss a session or detail again.
Guidyly helps you book, manage, and track every coaching session efficiently.
- Centralized session scheduling
- Automated client reminders
- Progress tracking & notes
No credit card required
Dashboard Structure
| Section | Metrics | Update Frequency | Warning Threshold |
|---|---|---|---|
| Revenue Health | EHR, Collection Rate, RPAC | Weekly | EHR <$75, Collection <90%, RPAC declining 2 months |
| Client Flow | Conversion, Activation, Lifetime | Bi-weekly | Conversion <25%, Activation <70%, Lifetime <4 months |
| Operations | Utilization, No-shows, Admin Ratio | Weekly | Utilization <60% or >90%, No-shows >10%, Admin >30% |
| Growth | Referral %, Reactivation, Completion | Monthly | Referral <30%, Reactivation <10%, Completion <60% |
The dashboard shouldn't just display numbers—it should highlight relationships between metrics. When utilization drops while no-shows increase, you have a client engagement problem. When RPAC rises but lifetime shortens, you're probably overpricing relative to perceived value.
Use conditional formatting to surface warnings at a glance.
Below is a simple workflow showing how data sources feed into KPIs and trigger alerts.
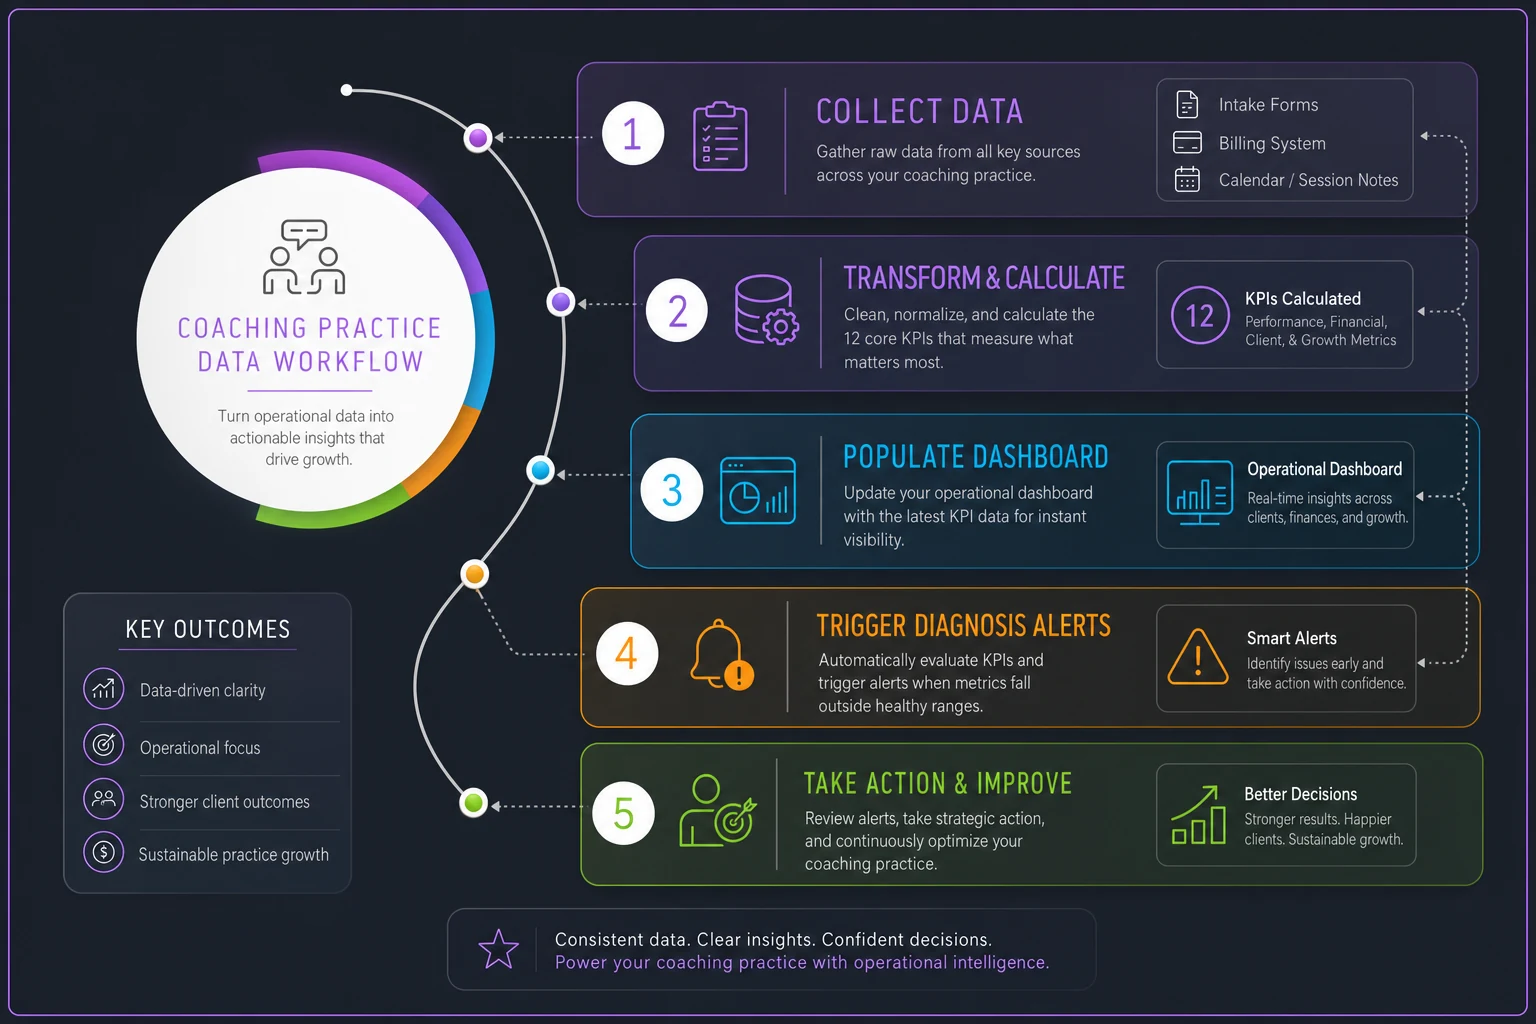
This flow clarifies how the pieces connect from raw data to decision triggers.
Exact Data Extraction Points
Getting clean data requires knowing exactly where to pull from:
From Intake Forms/CRM:
-
First contact date
-
Consultation date
-
Referral source
-
Program selected
-
Start date
From Billing System:
-
Invoice dates and amounts
-
Payment dates and amounts
-
Package/program purchases
-
Refunds or adjustments
-
Subscription status changes
From Calendar/Session Notes:
-
Scheduled sessions
-
Completed sessions
-
No-shows and cancellations
-
Session type (regular, emergency, group)
-
Time spent per session
-
Admin time blocks
Manual Tracking Needed:
-
Prep time per client
-
Follow-up communications
-
Program milestone completions
-
Client outcome achievements
Most coaches try pulling all of this manually each month and burn somewhere between four and six hours on spreadsheet updates. This is where AI-powered operational software changes things—automatically pulling data from your existing tools, calculating KPIs in real-time, and flagging issues before they compound.
Monthly Diagnosis Checklist: Connecting Metrics to Fixes
Week 1: Revenue Health Check
☐ Calculate EHR—if below target, review:
-
Session pricing vs market
-
Time boundaries with clients
-
Admin process efficiency
☐ Review collection rate—if below 90%:
-
Audit payment failure reasons
-
Check reminder sequences
-
Consider different pricing structures
☐ Analyze RPAC trends—if declining:
-
Review package offerings
-
Check upgrade/upsell processes
-
Evaluate perceived value delivery
Week 2: Client Flow Analysis
☐ Conversion rate assessment—if below 35%:
-
Review consultation process
-
Analyze objections in notes
-
Test pricing presentation changes
☐ Activation tracking—if below 75%:
-
Audit onboarding sequence
-
Check first-session experience
-
Review initial goal-setting process
☐ Lifetime value calculation—if shortening:
-
Analyze exit reasons
-
Review program pacing
Week 3: Operational Efficiency
☐ Utilization analysis—outside 70–85% range:
-
Adjust available slots
-
Review scheduling policies
-
Consider group offerings
☐ No-show patterns—if above 8%:
-
Implement confirmation sequences
-
Review cancellation policies
-
Check session scheduling gaps
☐ Admin time audit—if above 25%:
-
Identify repetitive tasks
-
Review documentation processes
-
Consider automation tools
Week 4: Growth Planning
☐ Referral source review—if below 40%:
-
Create referral moments
-
Implement asking framework
-
Develop referral rewards
☐ Reactivation opportunities—if below 15%:
-
Design re-engagement campaigns
-
Create "alumni" offerings
-
Build relationship maintenance system
☐ Completion rate analysis—if below 65%:
-
Review program structure
-
Analyze dropout points
-
Adjust milestone pacing
Running through this monthly doesn't have to be a full-day exercise. Most coaches who stick with it find the whole thing takes under an hour once the data sources are organized.
Quarterly Deep-Dive Combinations
High EHR + Low Lifetime = Pricing Problem You're charging premium rates but not delivering matching value. Either enhance the service or adjust pricing.
High Conversion + Low Activation = Onboarding Failure You're selling well but not engaging. Review your first 30 days.
High Utilization + High Admin Ratio = Scale Breaking Point You're maxed on capacity while drowning in admin. This combination actively kills growth.
Low Referrals + High Completion = Marketing Opportunity Clients are succeeding but not spreading the word. You need a more systematic approach to referral requests.
These combinations matter more than any single metric in isolation. A coach with a 78% utilization rate might look healthy on the surface, but pair that with a 34% admin ratio and the picture changes fast.
Red Flag Combinations That Demand Immediate Action
Collection Rate <85% + RPAC Declining Cash flow crisis incoming. Fix payment processes immediately.
Activation <65% + Conversion >50% You're overselling and underdelivering. Align your promises with the actual experience.
No-shows >12% + Utilization <65% Your client base is actively disengaging. That's a service or fit problem, not a scheduling one.
Admin >35% + EHR <$70 The business model is broken. You're working harder for less money.
Building Your Custom Tracking System
Tab 1: Raw Data Entry
-
Weekly session counts
-
Payment records
-
Client status changes
-
Time tracking
Tab 2: KPI Calculations
-
Automated formulas for all 12 metrics
-
Week-over-week changes
-
Running averages
Tab 3: Dashboard View
-
Visual indicators (red/yellow/green)
-
Trend arrows
-
Quarterly comparisons
Tab 4: Diagnosis Log
-
Metric combination flags
-
Action items triggered
-
Improvement tracking
The manual version works fine for practices under 20 clients. Beyond that, the time investment stops making sense. You'll spend more time updating spreadsheets than actually serving clients.
When Manual Tracking Breaks Down
Around 25–30 active clients, manual KPI tracking starts to fall apart. Not because the math gets harder, but because your data lives in too many places. Intake forms in one system, billing in another, session notes scattered across folders. By the time you compile everything monthly, you're analyzing history instead of managing the present.
This is where operational software becomes genuinely useful. Modern platforms can connect to your existing tools—calendar, payment processor, note systems—and calculate these KPIs automatically. Instead of spending a Sunday afternoon building reports, you get alerts when metrics drift outside target ranges.
The AI automation layer adds something you'd rarely catch manually. It starts surfacing patterns like clients who cancel Monday sessions being far more likely to drop completely, or your collection rate dipping every third week when you're traveling. Those patterns only show up when data flows continuously rather than getting batched once a month.
Making Your Dashboard Drive Decisions
A coaching KPI dashboard only matters if it changes behavior. A practical review rhythm that actually works looks something like this:
-
Daily Check utilization and upcoming week density — takes 30 seconds, spots scheduling problems before they hit.
-
Weekly Review EHR and collection status — five-minute scan, catches revenue leaks early.
-
Bi-weekly Analyze client flow metrics — 15-minute review, identifies engagement issues before they compound.
-
Monthly Run full diagnostic checklist — 45-minute deep dive, connects patterns to specific fixes.
-
Quarterly Strategic metric combination analysis — two-hour planning session, adjusts your business model based on actual trends.
The coaches who grow consistently aren't tracking more metrics—they're tracking the right ones and using the data to make adjustments. The gap between a $100k practice and a $300k practice often comes down to operational visibility and the discipline to actually respond to what the numbers show.
Moving from Reactive to Predictive
The real value in tracking these KPIs isn't just fixing current problems—it's catching future ones early. When you see activation rates drop from 78% to 71%, you can adjust onboarding before it hits retention. When EHR gradually declines over three months, you can restructure service delivery before profitability erodes.
Prediction requires consistent tracking and pattern recognition, though. That's nearly impossible with manual spreadsheets updated once a month. You need systems that track continuously, calculate automatically, and surface problems proactively. Whether you build it yourself or use operational software designed for coaches, proper KPI tracking typically pays for itself within a couple months through caught revenue leaks and prevented client losses.
Start with the five most relevant to your current challenges. Build the habit. Then expand from there as you get more comfortable using data to make decisions. The coaches who hold up in competitive markets aren't necessarily better at the actual coaching—they're better at running their operations. And that starts with knowing exactly what to track and what to do when the numbers shift.
Ready to elevate your coaching business?
Join hundreds of coaches using Guidyly to save time, enhance client engagement, and grow their practice.