



Most cohort pricing falls apart in the same spot: the coach picks a group size based on what feels manageable, sets a price based on what competitors charge, and never checks whether those two decisions actually agree with each other. They usually don't. A group of 12 at $1,200 a head looks great on a sales page and terrible once you count the facilitation hours, the async feedback, and the three extra admin touches each person needs.
This is about building one spreadsheet that forces those variables to talk to each other — group size, how much facilitation each size actually demands, the admin load that rides along, and what price point keeps your per‑participant margin where it needs to be. Not a pricing philosophy. A working matrix you can sort and filter until the right numbers fall out.
The real reason cohort math breaks
The problem isn't that coaches can't do arithmetic. Facilitation intensity doesn't scale linearly with group size, and most people price as if it does.
A one‑on‑one engagement might take you 1.5 hours of live time plus 30 minutes of prep and notes per session. Logically, a group of 8 costs you roughly the same live hour divided across 8 people — so per‑participant time drops dramatically. On the live‑delivery side, that's true. The trap is everything around the live session.
In a group of 8, you're still answering individual questions in the chat, reviewing 8 pieces of homework, handling 8 scheduling conflicts, and managing the one participant who's quietly disengaging and needs a nudge. That work doesn't divide. It multiplies. So per‑participant time doesn't collapse the way the live‑session math suggests — it bends.
What tends to show up across small coaching practices is that the "obvious" sweet spot — somewhere around 8 to 12 — is often the worst margin zone. Large enough to generate real admin and async load, but too small to spread fixed facilitation costs across enough paying seats.
What the matrix actually needs to model
Before building columns, you have to be honest about the inputs. Four of them do most of the work:
Never miss a session or detail again.
Guidyly helps you book, manage, and track every coaching session efficiently.
- Centralized session scheduling
- Automated client reminders
- Progress tracking & notes
No credit card required
-
Coach time per participant — broken into live, async (feedback, chat, reviews), and prep/notes. These behave differently as size grows, so don't lump them together.
-
Admin load per participant — scheduling, payment follow‑up, onboarding, the small logistical fires. This one scales almost linearly and people forget it entirely.
-
Per‑participant margin target — what you need each seat to clear after paying yourself an honest hourly rate for delivery time.
-
Facilitation intensity tier — a label (light / standard / high‑touch) that changes the async and prep assumptions for that program type.
The mistake most spreadsheets make is treating the coach's time as free. If you don't assign your delivery hours a real cost, every cohort looks profitable and you can't compare sizes meaningfully. Pay yourself on paper first.
Building the matrix
The core of the tool is a grid where each row is a cohort size and the columns calculate downstream from your inputs. Below is a simplified version using a "standard" intensity program where the coach values delivery time at $150/hr and wants at least a ~55% per‑participant margin after delivery cost.
| Cohort size | Live hrs/participant | Async hrs/participant | Admin hrs/participant | Total coach cost/participant | Price point | Per‑participant margin |
|---|---|---|---|---|---|---|
| 1 (solo) | 9.0 | 2.0 | 1.5 | ~$1,875 | $4,200 | ~55% |
| 4 | 2.6 | 1.8 | 1.4 | ~$870 | $1,950 | ~55% |
| 8 | 1.4 | 1.6 | 1.3 | ~$645 | $1,450 | ~56% |
| 12 | 1.0 | 1.5 | 1.3 | ~$570 | $1,300 | ~56% |
| 16 | 0.8 | 1.5 | 1.25 | ~$533 | $1,150 | ~54% |
| 20 | 0.65 | 1.5 | 1.25 | ~$510 | $1,050 | ~51% |
Notice what happens. Live hours per person drop fast, but async and admin barely move. By the time you hit 16–20, the live efficiency gain is nearly exhausted and the async/admin floor dominates your cost. Pushing past 16 to chase volume starts eroding margin unless you raise price — which larger groups usually resist because buyers expect a per‑seat discount at scale.
This is the insight the grid surfaces that gut‑feel pricing never does: there's a size band where margin is maximized, and it's narrower than most coaches assume.
How to read the output (the part people skip)
A matrix is only useful if you know what question you're asking it. Three practical ways to use this one:
-
Fix the price, find the size. If market research says your program can't clear more than $1,300, the grid tells you which cohort sizes actually hit your margin at that ceiling. Often it's a tighter range than you'd hope.
-
Fix the size, find the price. If you want groups of 12 for community and facilitation reasons, the grid tells you the minimum price that keeps margin intact — and whether that price is actually sellable.
-
Fix the margin, compare programs. Run the same matrix for a "high‑touch" intensity tier and you'll see that the same group size needs a meaningfully higher price. This stops you from pricing a high‑touch cohort like a standard one, which is one of the quietest margin leaks in group coaching.
Worth flagging: when coaches run this for the first time, the high‑touch program is almost always underpriced relative to its intensity tier, and the light‑touch program is often over‑facilitated for what it charges. The matrix makes both visible side by side.
A real scenario
A solo coach running a 10‑week leadership cohort had settled on groups of 12 at $1,100, mostly because a peer charged something similar. On paper it looked like a $13k launch. Good money.
When the hours got written down honestly, the picture shifted. Each participant was pulling about 1.5 hours of async feedback and roughly 1.3 hours of scattered admin — scheduling swaps, payment nudges, a couple of "can we talk 1:1 real quick" asides that weren't part of the offer. Add live delivery and prep, and the per‑participant coach cost sat near $540. At $1,100, the margin was thinner than expected once delivery time was paid at a real rate, and the side conversations were pure unpriced leakage.
Two changes came out of it. The price moved to $1,275 — a modest bump the market absorbed without pushback — and the 1:1 asides got folded into a clearly defined, limited office‑hours block instead of ad‑hoc. Admin time per participant dropped by roughly 20–25 minutes just from removing the scheduling chaos. Nothing dramatic happened to headline revenue, but the margin per cohort improved by a few thousand dollars, and the coach stopped finishing each cohort feeling underpaid for the real hours worked.
The number that mattered wasn't the price. It was finally seeing that the async‑plus‑admin floor was setting the economics, not the live session everyone focuses on.
When this matrix makes sense
There's a certain type of coaching business where this tool earns its keep almost immediately, and a few where it's genuinely not worth the setup.
It makes sense if:
-
You run (or want to run) more than one cohort size and keep second‑guessing which to sell.
-
Your programs vary in intensity and you suspect you're pricing them too similarly.
-
You've grown groups to "scale up" and quietly noticed the bigger ones feel less profitable than the smaller ones.
-
You're setting price from competitor benchmarks instead of your own cost structure.
It's a bad fit if:
-
Your revenue is almost entirely 1
1 and you have no real intention of running groups. You'd be modeling a business you don't operate.
-
Your async and admin work is genuinely negligible — rare, but a few pure‑content cohorts with no feedback loop qualify. In that case live hours really do dominate and the matrix tells you less.
-
You haven't tracked your actual hours yet. Building this on guessed inputs produces confident, wrong answers. Capture a cohort's real time first, even roughly, then model.
If you're in that last bucket, start with honest time tracking before pricing. The caseload and time math in this capacity‑planning breakdown is a cleaner place to begin, since the matrix here depends entirely on knowing your real per‑participant hours.
Where the inputs usually go wrong
A few recurring mistakes that quietly poison the output.
Averaging intensity across different programs. If you blend a high‑touch and a light‑touch cohort into one "typical" assumption, both prices come out wrong. Model intensity tiers separately.
Forgetting the disengagement tax. Every group has one or two people who need extra chasing. That's real admin time. Pad your admin‑per‑participant input slightly rather than modeling the ideal, fully‑engaged cohort that never actually exists.
Ignoring prep that scales with group heterogeneity. Bigger groups often mean more varied needs, which means more prep, not less. The live hours drop but prep can creep. Watch that column.
Setting one margin target for everything. A flagship program and an entry‑level cohort shouldn't carry the same margin expectation. The entry offer can run leaner if it feeds the flagship — but decide that on purpose, in the sheet, not by accident.
Turning this into a repeatable decision
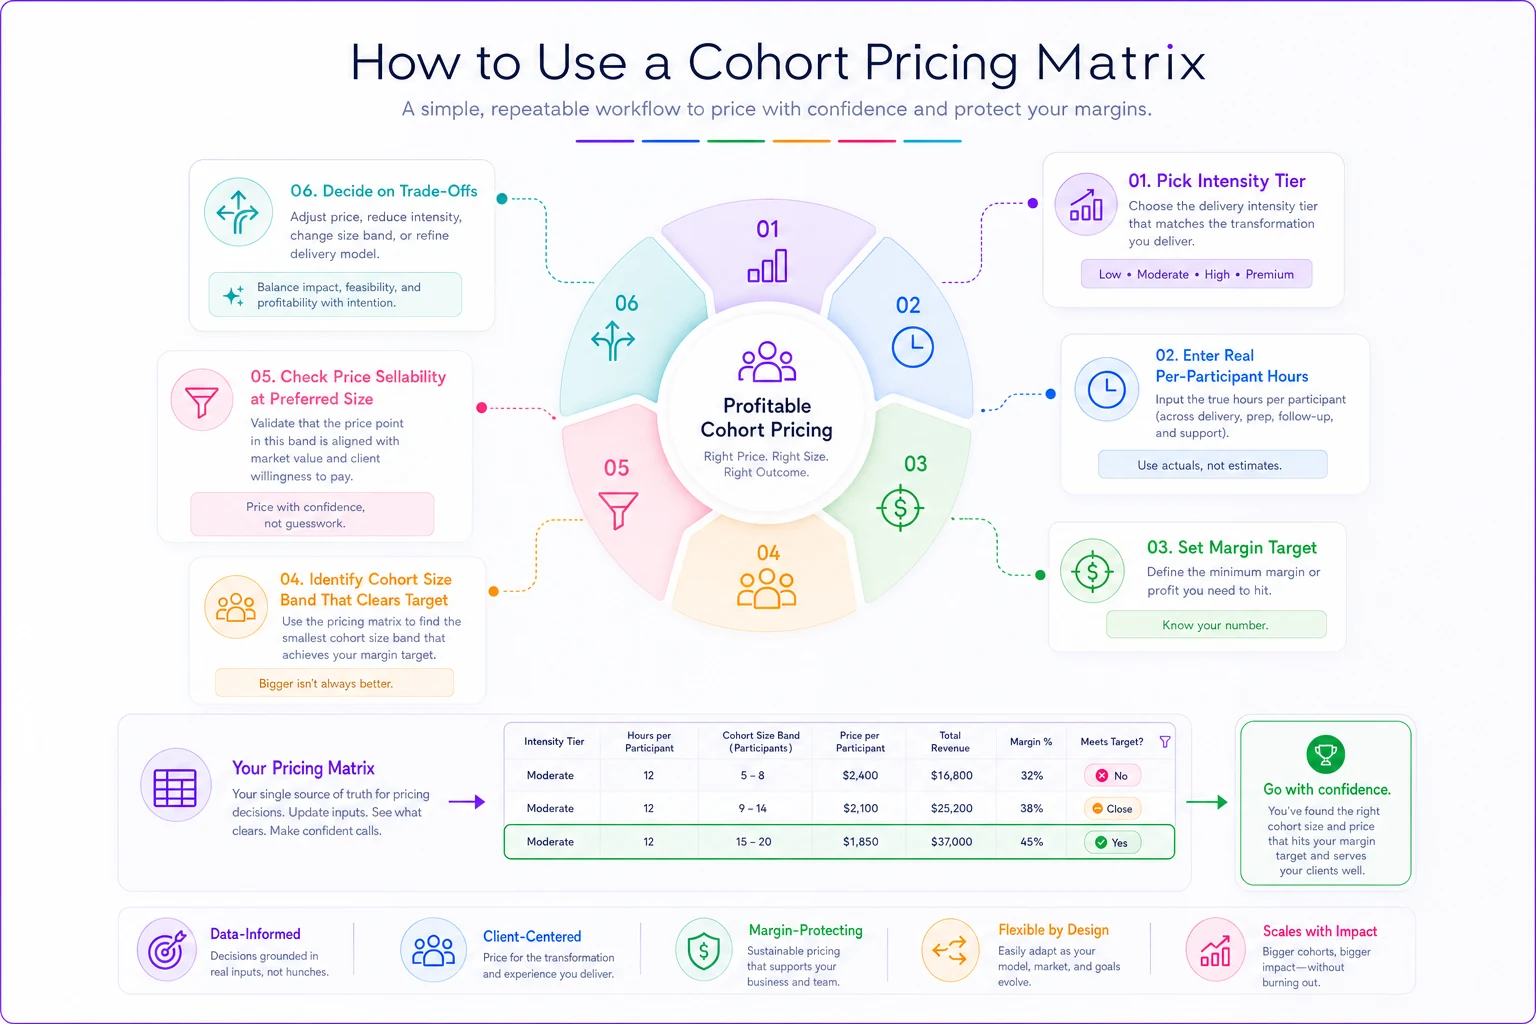
Once the matrix works, it stops being a one-time exercise and becomes what you run before launching any new group format. The workflow is straightforward:
-
Pick the intensity tier for the program you're designing.
-
Drop in your real per‑participant hours for that tier — pulled from actual cohort tracking, not estimates.
-
Set your margin target.
-
Read the cohort size band that clears it.
-
Check whether the price the grid demands is one the market will actually pay at your preferred size.
-
If it isn't, decide
reduce async load, shrink the group, or accept a lower margin on purpose.
That last step is the quiet payoff. Trade‑offs still happen — everyone makes them — but you make them with the numbers in front of you instead of discovering them three cohorts later.
Quick visual of that workflow:
When you're ready to package these cohorts into cleaner, repeatable formats with defined scope, the thinking in this modular program system walkthrough pairs well with the pricing side, since tighter scope is usually what fixes the async‑and‑admin floor the matrix keeps exposing.
Closing thought
Coaches rarely lose money on the live session. They lose it in the gap between what the live math suggests and what the whole engagement actually costs — the async feedback, the scheduling churn, the unpriced side conversations that never made it onto the sales page.
A small cohort pricing matrix doesn't eliminate that gap, but it makes it visible. Put those two numbers next to each other once, and your group sizes and price points tend to sort themselves out faster than any benchmark ever could.
Coaches rarely lose money on the live session. They lose it in the gap between what the live math suggests and what the whole engagement actually costs — the async feedback, the scheduling churn, the unpriced side conversations that never made it onto the sales page.
A small cohort pricing matrix doesn't eliminate that gap, but it makes it visible. Put those two numbers next to each other once, and your group sizes and price points tend to sort themselves out faster than any benchmark ever could.
Ready to elevate your coaching business?
Join hundreds of coaches using Guidyly to save time, enhance client engagement, and grow their practice.